Shoppers Gobble Up In-Store Black Friday Deals On Mobile
As another Black Friday weekend wraps, we saw supershoppers continue to turn to their devices for ideas and information as well as use them as a “door-to-the-store.” In fact, Black Friday had the highest mobile shopping searches of any day during Thanksgiving week this year. Thanksgiving Day was a close second, with searches peaking at 8:00 p.m.1
Further, shoppers across the U.S. turned to mobile to not only find the best deals online but also to discover the best deals in-store: Rhode Island and Delaware had the most local shopping search interest -- searches that contained “near me,” hours and stores -- of any states in the nation.2
This strong link between the online and physical world lives beyond the holidays too, and store visits reporting in AdWords is helping advertisers understand it year round. In fact, in just under two years, advertisers globally have measured over 3 billion store visits.
What else did we see in stores over the holiday weekend? Store foot traffic jumped 65% on Black Friday, compared to an average weekend day in November, showing that consumers still care about going into stores for holiday shopping. Clothing, toy, and electronic stores were all popular destinations. Clothing stores and toy stores saw more than double the foot traffic on Black Friday compared to an average weekend day in November.3
Electronics stores were particularly popular, with more than double the foot traffic on Thanksgiving Day and more than triple the foot traffic on Black Friday, compared to an average weekend day in November.4 That makes sense given electronics, including the Nintendo Entertainment System and Sony PS4 Pro, are topping shoppers’ gift lists this year.5
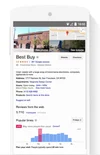
Popular Times feature in Google Maps: Live store foot traffic on Black Friday in Best Buy as indicated by pink bar
1. Google Search Data, U.S., apparel, home & garden, beauty & personal care, computers & electronics, gifts, toys & games, photo & video; mobile only, Nov 2016
2. Google Search Data, U.S., apparel, home & garden, beauty & personal care, computers & electronics, gifts, toys & games, and photo & video; search interest in "near me," "hours," and "stores"; local searches' popularity as a fraction of total shopping searches in that location, mobile only, Nov. 2016
3. Google Data, Aggregated, anonymized store traffic for Department, Clothing, Electronics and Toy stores, and Shopping Centers from a sample of U.S. users that have turned on Location History, November
4. Google Data, Aggregated, anonymized store traffic for Electronics stores from a sample of U.S. users that have turned on Location History, November 2016.
5. Google Shopping Insights, U.S., all devices, Nov. 1 – Nov. 13, 2016.
6. Google Data, Aggregated, anonymized store traffic for Electronics stores from a sample of U.S. users that have turned on Location History, November 2016.
Shoppers also spent more time in stores. For example, in electronics stores, they typically spent between 35 minutes and 1.5 hours on Black Friday compared to 25 minutes on an average day in November. Shopping malls showed a similar increase in visit duration compared to the average day in November.6
To get deeper insight into store visits performance, visit the AdWords Help Center and learn about two new distance and location reports coming soon that will help you understand where your store visits come from.
1. Google Search Data, U.S., apparel, home & garden, beauty & personal care, computers & electronics, gifts, toys & games, photo & video; mobile only, Nov 2016
2. Google Search Data, U.S., apparel, home & garden, beauty & personal care, computers & electronics, gifts, toys & games, and photo & video; search interest in "near me," "hours," and "stores"; local searches' popularity as a fraction of total shopping searches in that location, mobile only, Nov. 2016
3. Google Data, Aggregated, anonymized store traffic for Department, Clothing, Electronics and Toy stores, and Shopping Centers from a sample of U.S. users that have turned on Location History, November
4. Google Data, Aggregated, anonymized store traffic for Electronics stores from a sample of U.S. users that have turned on Location History, November 2016.
5. Google Shopping Insights, U.S., all devices, Nov. 1 – Nov. 13, 2016.
6. Google Data, Aggregated, anonymized store traffic for Electronics stores from a sample of U.S. users that have turned on Location History, November 2016.